A role-playing dimension is a dimension that can filter related facts differently.
In layman’s terms it is used in all those cases where you use one same dimension to create more than one relationship to your fact table.
The role-playing dimension is often used with the Date dimension since in many cases the table of fact contains several different date fields.
In this example there are the Orderdate and Shipdate fields in the Date dimension table which may not have the same values.
As you can see the Date dimension table has two relations with the Sales facts table and therefore can be used to filter both through Orderdate that through Shipdate
For example, the Date dimension table has two relationships to the Sales facts table.
The same dimension table can be used to filter the facts by OrderDate and ShipDate.
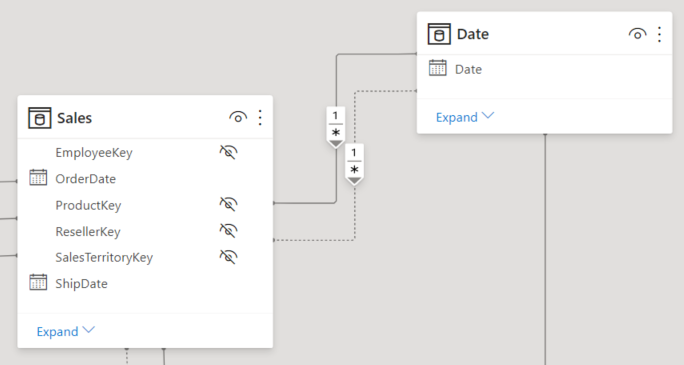
Be careful! Power BI data model allows only one active relationship between two tables and all remaining relationships must set to inactive.
In this example:
- there is an active relationship from Date | Date to Sales | OrderDate
- there is an inactive relationship (this relation is marked with a dotted line) from Date | Date to Sales | ShipDate
This means that filters applied to the Date table are automatically propagated to the OrderDate column of the Sales table.
The only way to use an inactive relationship is to define a DAX expression that uses the USERELATIONSHIP function.
This function enables us to define which relationship should be active for a specific calculation.
Order Shipped measure is built with a DAX expression like below:
Orders Shipped =
CALCULATE(
DISTINCTCOUNT(Sales[SalesOrderNumber]),USERELATIONSHIP(‘Date'[Date], Sales[ShipDate]))
You can explicitly say to Power B that you don’t want to use the default active relationship from Date | Date to Sales | OrderDate.
Instead, you want you to switch to using another relationship Date | Date to Sales | ShipDate and make this relationship active only for this calculation.
In this implementation example, there are limitations on how the data can be reported, it’s not possible to simultaneously filter sale orders by different types of data: it’s not possible to build a visualization that plots order date sales by shipped date sales.
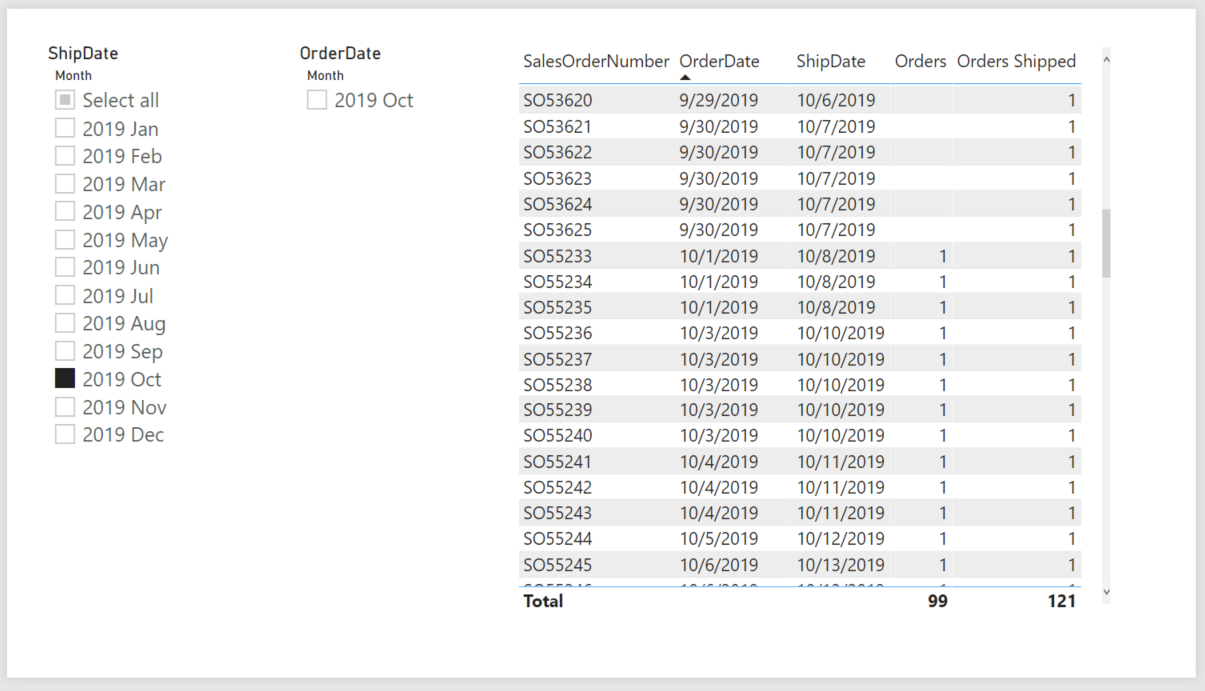
You will notice that it is not possible to obtain the list of orders with a specific registration date in filtered filter by a different order shipping date.
For example, you cannot get the list of orders registered in October 2019 that were shipped in November 2019.
How would you answer the following question: “What are the sales orders in October 2019 to be shipped in November 2019?”
We should review the data model. A common Power BI modeling technique is to create a dimension table for each role-playing instance.
So, we must create another table.
You typically create the additional dimension tables as calculated tables, using DAX.
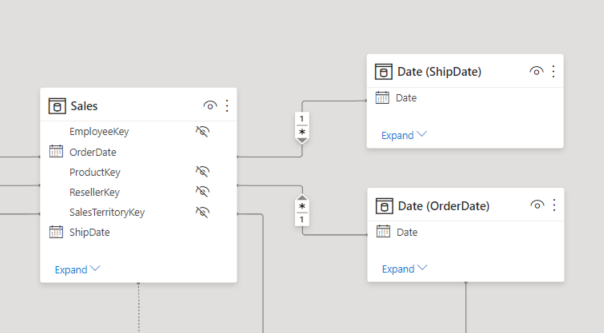
Now we have two active relationships:
- Date | Date to Sales | OrderDate
- Date | Date to Sales | ShipDate
In addition, the Date (ShipDate) table is built with a DAX expression like below:
Date (ShipDate) = ‘Date (OrderDate)’
Finally, we can obtain a visualization like this:
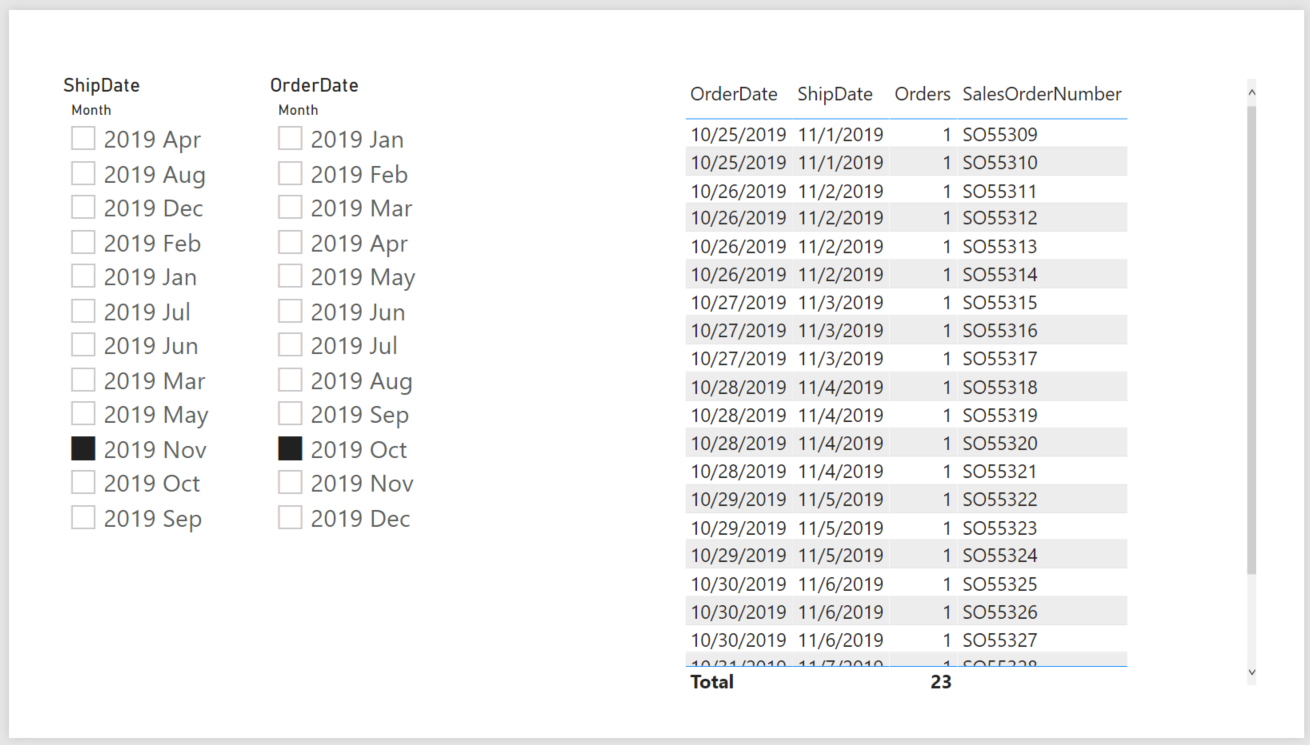
We can simultaneously filter sales orders for by ShipDate and OrderDate and visualize the list of sales orders with OrderDate in October 2019 and shipment date to ship in November 2019.
Take care!!
Leave A Comment
You must be logged in to post a comment.